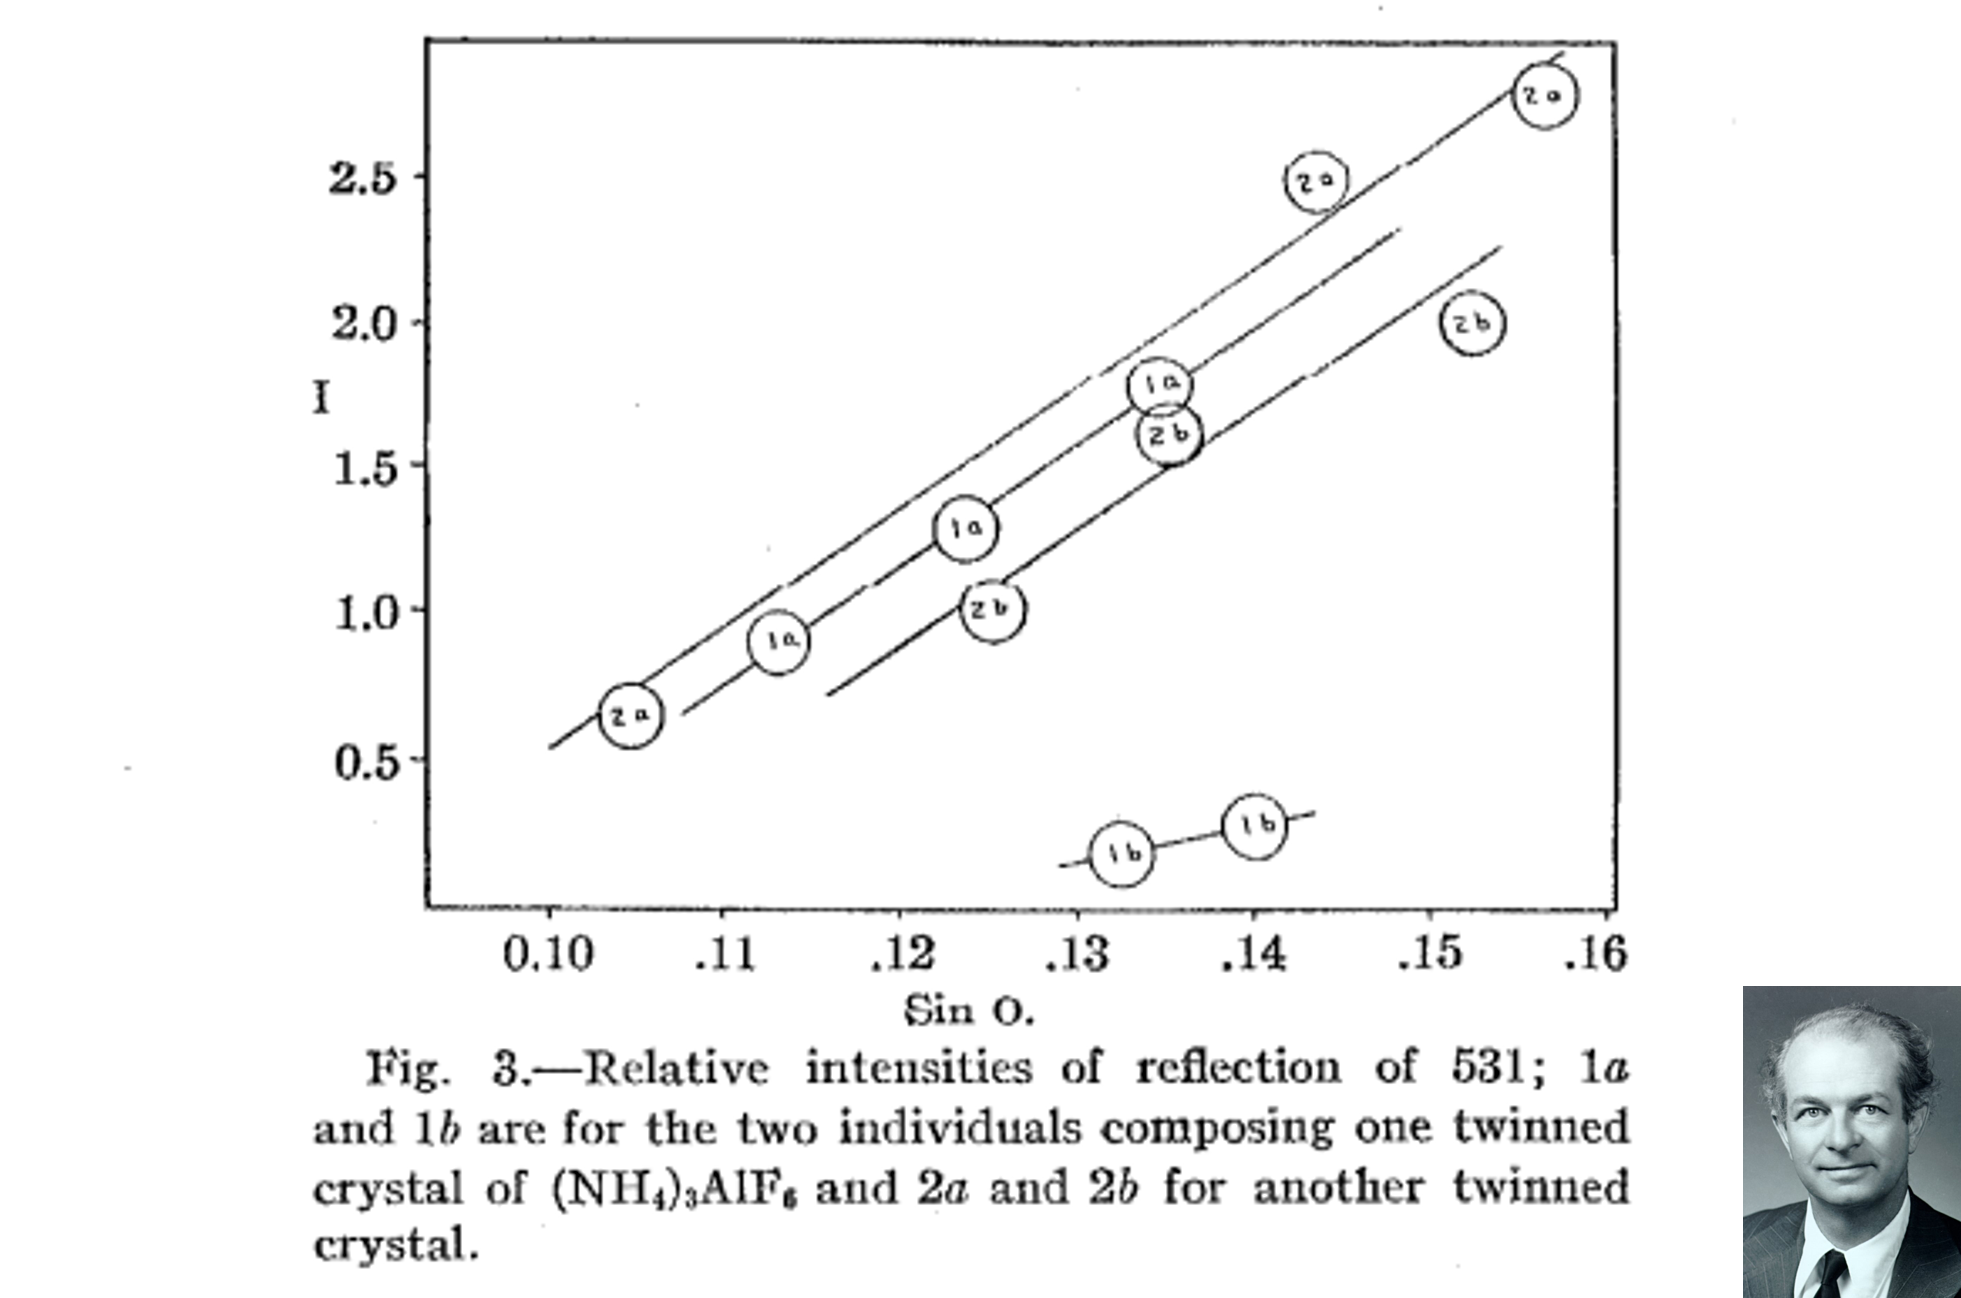
Scientists have used data to make decisions for a very long time. The diagram below is from Linus Pauling’s PhD thesis, close to a hundred years old, plotting reflection intensities from a twinned crystal to work out its structure. He was rigorously data-driven before the phrase existed. So when an organisation says it wants to be data-driven today, it is worth asking what is actually new. It is not the fact that people use data. It is whether that data, once collected, ends up in a state where it can train a model, rather than just support the one decision it was gathered for.
This note lays out a simple six-stage cycle for thinking about data in R&D, based on the author’s experience building a Digital R&D function from scratch, shows where most organisations get stuck, and explains what actually opens up once that gets fixed: real predictive modelling, not just better reporting.
The six stages
Data moves through a cycle with six stages:
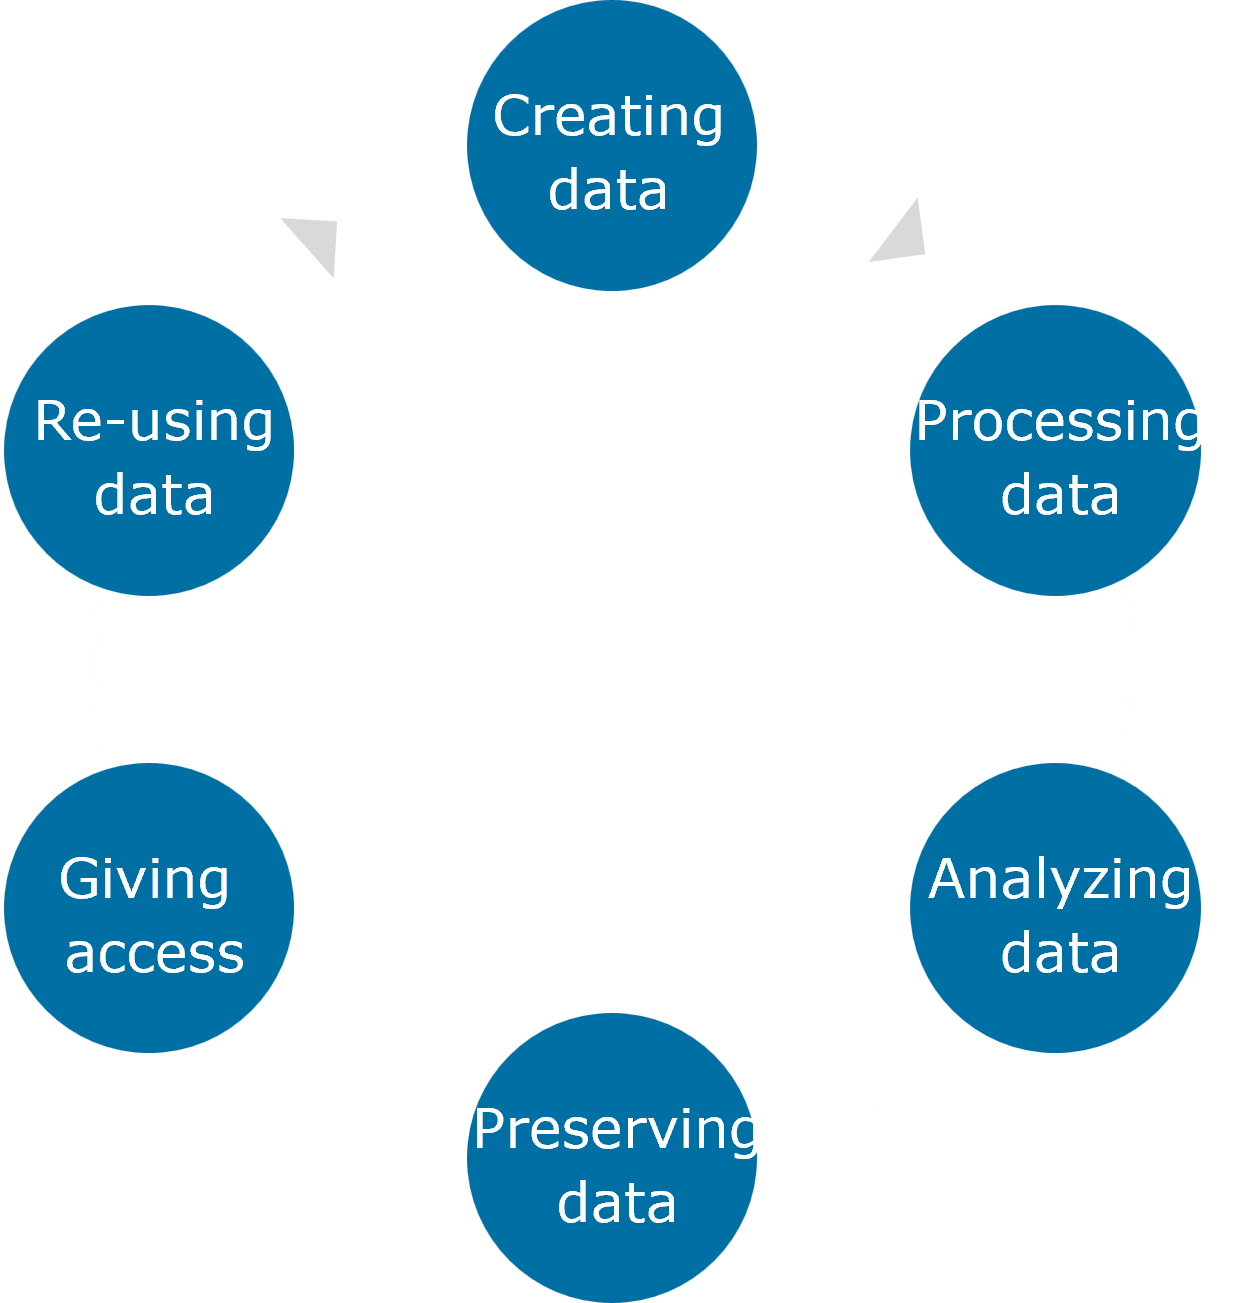
- Creating data. An experiment runs, a measurement is taken, a sample is characterised. This is the moment data comes into existence.
- Processing data. Raw readings get converted into something usable, cleaned, structured, and put into a consistent format.
- Analysing data. The processed data gets interpreted, compared, modelled, or turned into a conclusion.
- Preserving data. The data and its context get stored somewhere durable, in a form that will still make sense to someone else, or to you, a year from now.
- Giving access. The right people can find and open the data without having to ask the person who created it.
- Re-using data. The data gets picked up again for a new question it was not originally collected for.
Where organisations tend to be strong
Most R&D organisations are genuinely good at the first three stages. Scientists create data constantly. Processing and analysis are core scientific skills, taught early and practiced daily. This is why the “look, I am already data-driven” objection comes up so often when digital transformation is discussed. It is true. Analysing data well is not new, and it is not what separates a mature digital organisation from an immature one.
Where the cycle actually breaks
The break tends to happen at preservation. Data gets analysed for the purpose it was collected for, a report gets written, a conclusion gets reached, and then the underlying data sits in a personal folder, an old lab notebook, or a spreadsheet on someone’s laptop. It survives in a form that made sense to the person who created it, and to almost nobody else.
Access is the next casualty. Even when data is technically stored somewhere central, that does not mean anyone else can find it. A shared drive with thousands of unlabelled files is not really accessible, even though the data is, strictly speaking, there.
Re-use is where the value of the whole cycle either shows up or quietly disappears. A formulation trial from three years ago, sitting in a well organised, findable, well described dataset, can train a model or answer a new question today. The same trial, buried in an old presentation nobody can locate, cannot.
It is not only measurements
Everything so far has used structured, numeric data as the example: a measurement, a reflection intensity, a formulation trial. But a large share of what R&D organisations generate is narrative, not numeric. Project reports, patent filings, literature reviews, technical memos. These go through the same six stages, and they tend to break at the same point—preservation, access, and re-use—except the failure looks a bit different.
With numeric data, the failure is usually that nobody can find the file. With narrative data, the file is often easy enough to find. The real failure is that nobody can get intelligence out of it at scale. A single report is readable. A hundred reports, written over several years by different people in different formats, are not something anyone is going to read end to end to find a pattern. Can you pull together intelligence from individual reports in your repository to create new insight, without reading through hundreds of documents one after another? For most organisations, the honest answer is no, not without a large, one-off manual effort. That is a re-use failure, just as real as a lost spreadsheet, and arguably a bigger source of lost value, since narrative documents make up so much of what R&D actually produces.
What reusable data actually enables
Fixing preservation, access, and re-use is not just tidiness for its own sake. It is what makes a specific, valuable thing possible: building a model that predicts an outcome instead of only recording one after it happened. This is what data-driven modelling actually means in practice, and it usually takes one of a few forms.
A recommender engine looks at past choices—ingredients selected, formulations tried, and their outcomes—and learns which combinations tend to work well together. Given a new project, it suggests a shortlist worth trying, instead of starting from a blank page.
A predictive screening model, sometimes called in-silico screening, is trained on historical experimental results and learns to estimate how a new combination or condition would likely perform, before anyone runs the physical experiment. It does not replace the lab. It narrows down what is worth testing there, so lab time goes toward the most promising candidates rather than a wide, unguided search.
An optimisation algorithm works across a whole portfolio rather than one project at a time. Trained on data spanning many products or processes, it can identify adjustments that improve outcomes broadly—cost, yield, or sustainability—rather than tuning one formulation in isolation.
None of these are magic. A model is only as good as the data it learns from, and it needs more than one clean dataset to learn a real pattern rather than memorise a handful of one-off cases. It needs volume, consistency across examples, and enough variety to generalise. That is exactly why the earlier stages matter so much. A model cannot train on data that was never preserved, cannot be built by a team that cannot access it, and cannot generalise from examples that were never collected in a comparable way to begin with. The gap in preservation, access, and re-use is not a data hygiene issue sitting off to the side of predictive modelling. It is the reason most predictive modelling initiatives stall before they produce anything usable.
A better test than “do we use data”
Asking whether an organisation is data-driven is not a very useful question, since almost every R&D organisation would answer yes, and would be right. A more useful question is narrower, and it is worth asking in two forms. For numeric data: can someone other than the original author find and reuse a specific dataset from eighteen months ago, without tracking down the person who created it. For narrative data: can someone pull a cross-cutting insight out of a hundred old reports without reading all hundred of them. Both questions tend to produce a much more honest answer than “are we data-driven,” and both point at the same place—preservation, access, and re-use—rather than creation or analysis.
Different parts of the organisation will be at different points
As with the wider scope of digital, this is not something an organisation sits at as a single point either. A well run clinical trial data process might already handle preservation and access properly, because regulation forces the discipline. A newer, more exploratory research area might have excellent analysis and almost no preservation at all. The six-stage cycle is a diagnostic to apply use case by use case, not a single score to assign to the whole organisation.
What this has to do with Excel
In an earlier piece, I wrote about how heavy reliance on Excel and PowerPoint signals immaturity in how an organisation supports decisions, and about the tools that help people move beyond them. That argument is about tool choice at the point of analysis. This one is about something that happens after analysis is finished. A well chosen self-service tool can still leave you with data that nobody preserves, finds, or reuses once the immediate decision has been made. Both gaps are worth closing, but they are not the same gap.
Frequently asked questions
What does an R&D organisation need before it can build predictive models?
Data that has gone through the full cycle: created, processed, analysed, preserved, made accessible, and reused. Most organisations are strong at the first three stages and weak at the last three, which is usually where predictive modelling initiatives stall.
Why doesn’t more data automatically lead to better models?
A model needs volume, consistency across examples, and enough variety to learn a real pattern. Data that was never preserved in a comparable, accessible form cannot be used for training, no matter how much of it exists somewhere.
Does data-driven modelling only apply to numeric, measured data?
No. Narrative sources—project reports, patents, technical memos—go through the same cycle and tend to break at the same point. The failure looks different: the documents are usually easy to find, but pulling a pattern out of hundreds of them without reading each one is rarely possible without the right extraction tools in place.
What’s a simple way to test whether an organisation is really data-driven?
Ask whether someone other than the original author can find and reuse a specific dataset from eighteen months ago without tracking down the person who created it. For narrative data, ask whether someone can pull a cross-cutting insight out of a hundred old reports without reading all of them.